Understand your revenue cap (intäktsram). Improve the performance behind it.
What the report covers
Why you are regulated the way you are, how you perform against the field you are actually measured against, and what-if scenarios for what would improve it.
1
How you perform compared to the rest of the market
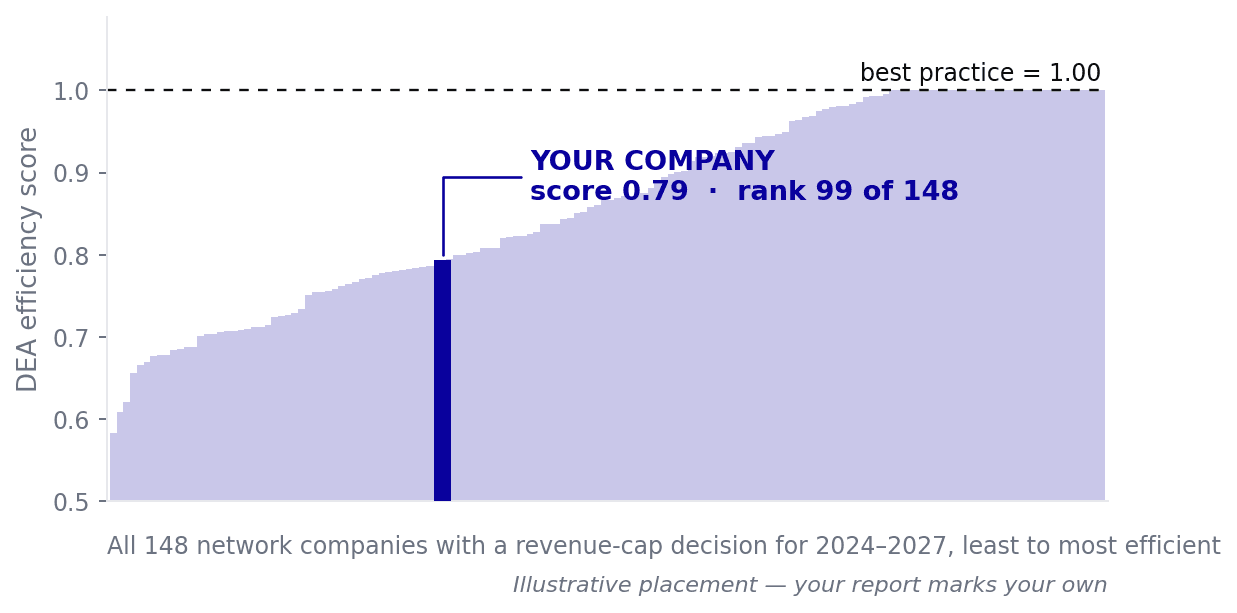
Your position among the 148
Your efficiency score, your potential, and the requirement that followed from it.
Benchmark line by line
Each input and output in the model, your value against the frontier’s, with the difference stated. This is where a potential stops being a single percentage and becomes a set of specific quantities.
2
What the gap is worth
What the distance to the frontier is worth in monetary terms — this year, and across the rest of the period.What the gap is worth in monetary terms
The efficiency requirement converted into money: what it removes from your controllable cost allowance in each year of the period. Your revenue cap itself is fixed until 2027, so a cost removed during the period stays with the company rather than being handed back — which is what makes the difference between the two figures worth knowing precisely.
What it is worth over time
The performance you carry into the next supervisory period is the ground the next decision is built on. The report shows what moves that position, and what each movement is worth.
3
Who your frontier is drawn from
Your performance against the specific companies your frontier was actually drawn from — named, and with the weight each of them carried in your result.Who defines your frontier, and with what weight
DEA does not measure you against the field. It measures you against a handful of specific companies — your role models — each carrying a weight in the comparison.
The role models in full
The complete table behind the previous section: every company that contributes to your frontier, its weight, and the input and output values it contributes.
What efficient means here
DEA in four steps, in plain language and without notation. Efficiency in this model is not a ratio and not a comparison with an average — it is a distance to a frontier built from the companies that were observed to do best. The section exists so that everything after it can be read without taking the method on trust.
4
What would move it
Which movements in your costs and services change the result, and how robust the regulator’s verdict is: what happens to your score if one or more of your role models is taken out of the model.Scenarios
What your score and your requirement become if you move what you can move. Because the potential is a frontier result, and the regulator has its own procedure for translating potential into requirement, a change in your spend does not translate one-for-one into a change in the requirement.
Context or performance
Your key figures indexed against companies of your size, with the context variables marked — the ones that describe the network you inherited rather than the way you run it. This is what separates a cost that is high because of what you operate from a cost that is high because of how it is operated.
How robust the verdict is
What happens to your score and your requirement if one or more of your role models is removed from the model. A result that rests on a single comparator is a different thing from one that survives its removal, and you cannot tell which you have from the decision.
Action plan
The levers that follow from the analysis, ordered by their effect on the potential and requirement — the ranking the model itself produces, with the monetary values attached to each one.
5
How the number was built
Every choice behind the number written down — the model, the assumptions laid on top of it, and where our figures differ from the published tables.How the requirement was arrived at
Ei sets each network company’s allowed revenue for the 2024-2027 supervisory period, and part of that decision is an annual efficiency requirement on your controllable costs. It comes out of a DEA model: Ei estimates each company’s efficiency potential, caps it at 30 per cent, assumes half is realisable within the period — four regulatory years against an eight-year realisation horizon — and splits the expected gain evenly between customers and the company. Written out: max[1 per cent, (1 + ¼ × min(potential, 30 per cent))^(1/4) − 1]. Below 16.2 per cent potential the floor of 1 per cent binds; above 30 per cent the ceiling of 1.82 binds; between them the requirement responds to how the company performed.
None of this is secret. The decisions and the methodology appendix behind them are public, and the data is open. What is missing is precision and interpretation. Nothing published says which companies your frontier was drawn from, how much each of them counted, or which of your cost movements would change the potential and requirement.
Answering that means reconstructing the model, not reading the decision — on the same DEA and SFA research base that underpins regulatory benchmarking of this kind across Europe. Professor Peter Bogetoft of Copenhagen Business School has spent his career on these models: their construction, their failure modes, and their use in exactly this regulatory setting.
- Intäktsram
- Your allowed revenue for the 2024-2027 supervisory period, decided company by company.
- Påverkbara kostnader
- The controllable cost base the efficiency requirement is applied to — a four-year average, 2018-2021, restated at 2022 price level.
- Effektiviseringskrav
- The annual efficiency requirement itself: minimum 1 per cent, maximum 1.82 per cent per year for this period.
- Effektiviseringspotential
- The DEA result the requirement is derived from — published rounded to whole per cent, and capped at 30 before it is used.
What you are measured on
The two inputs and five outputs the model runs on, with your own figures in them. The model reduces the inputs and holds the outputs fixed: it asks how little controllable operating cost and regulatory capital cost would be needed to deliver the service you already deliver.
Method, assumptions and reconciliation
The full model specification, every assumption stated, and a reconciliation against Ei’s own published figures. The analysis is auditable and replicable by your own team or an external reviewer.
Understand the model behind your efficiency requirement
Tell us which company you are asking about and we will confirm coverage, the regulatory years available, and what the report will contain.
Request a report